
Machine Learning Fish eDNA Analysis
- KEYWORDSeDNA, fish biodiversity, dimensionality reduction, random forest, CTD profile, community structure, DOPPIO
- ADVISORDr. Josh Kohut, Rutgers University
- WEBSITEhttps://github.com/henrysun9074/fishics
Project Overview
Summer 2024 NSF REU project conducted over 10 weeks at Rutgers University culminating in poster presentation. Addressing two primary research questions:
Q1: Evaluating the effectiveness of various dimensionality reduction techniques for encoding eDNA data, including linear and non-linear methods: principal component analysis (PCA), t-SNE and UMAP, and a custom variational autoencoder (VAE).
Q2: Using oceanographic data (namely salinity, temperature, and density/stratification) generated from Rutgers' DOPPIO model and CTD profiles taken during eDNA sampling to predict fish community structure using random forests. For a map of eDNA stations where data was collected, click here.
Rationale
eDNA allows scientists to collect genetic material shed by fish into the water using water sampling rather than trawls or nets. By combining this genetic information with oceanographic data like temperature and salinity, we can see how different ocean conditions affect where fish live and how they behave, and whether this relationship is affected by seasonality. From a more technical perspective, this research also seeks to apply new computing methods like neural networks (autoencoders) and tree-based machine learning models towards analysis of eDNA data, serving as a framework to guide future research.
Results
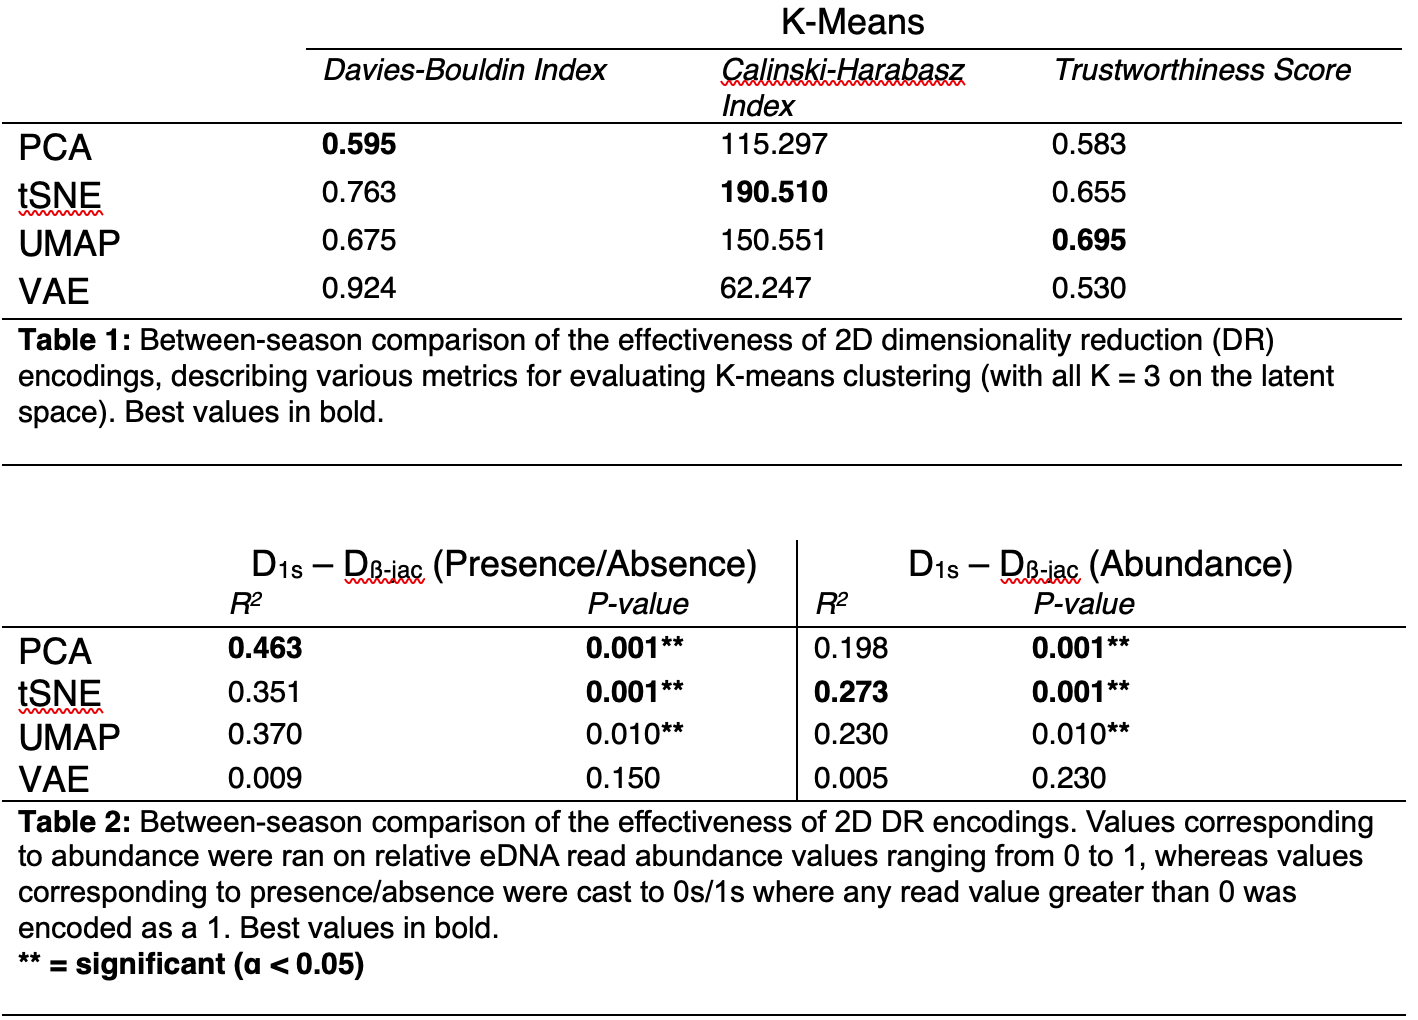
Q1: See the GitHub repo with all code for this question - just finished analysis! Took heavy inspiration from Lamperti et al. 2023 for the design here. I tested 4 different dimensionalty reduction techniques, PCA, tSNE, UMAP and VAE. Then, I ran multiple regression matrices on the Jaccard distance and Euclidean distance of reduced-dimension data to evaluate how well the high-dimensional structure of eDNA abundance data is represented in two dimensions. I also ran k-means clustering with k=3 on each method's 2D encoding to compare various clustering metrics. My results for this question are in the table below!
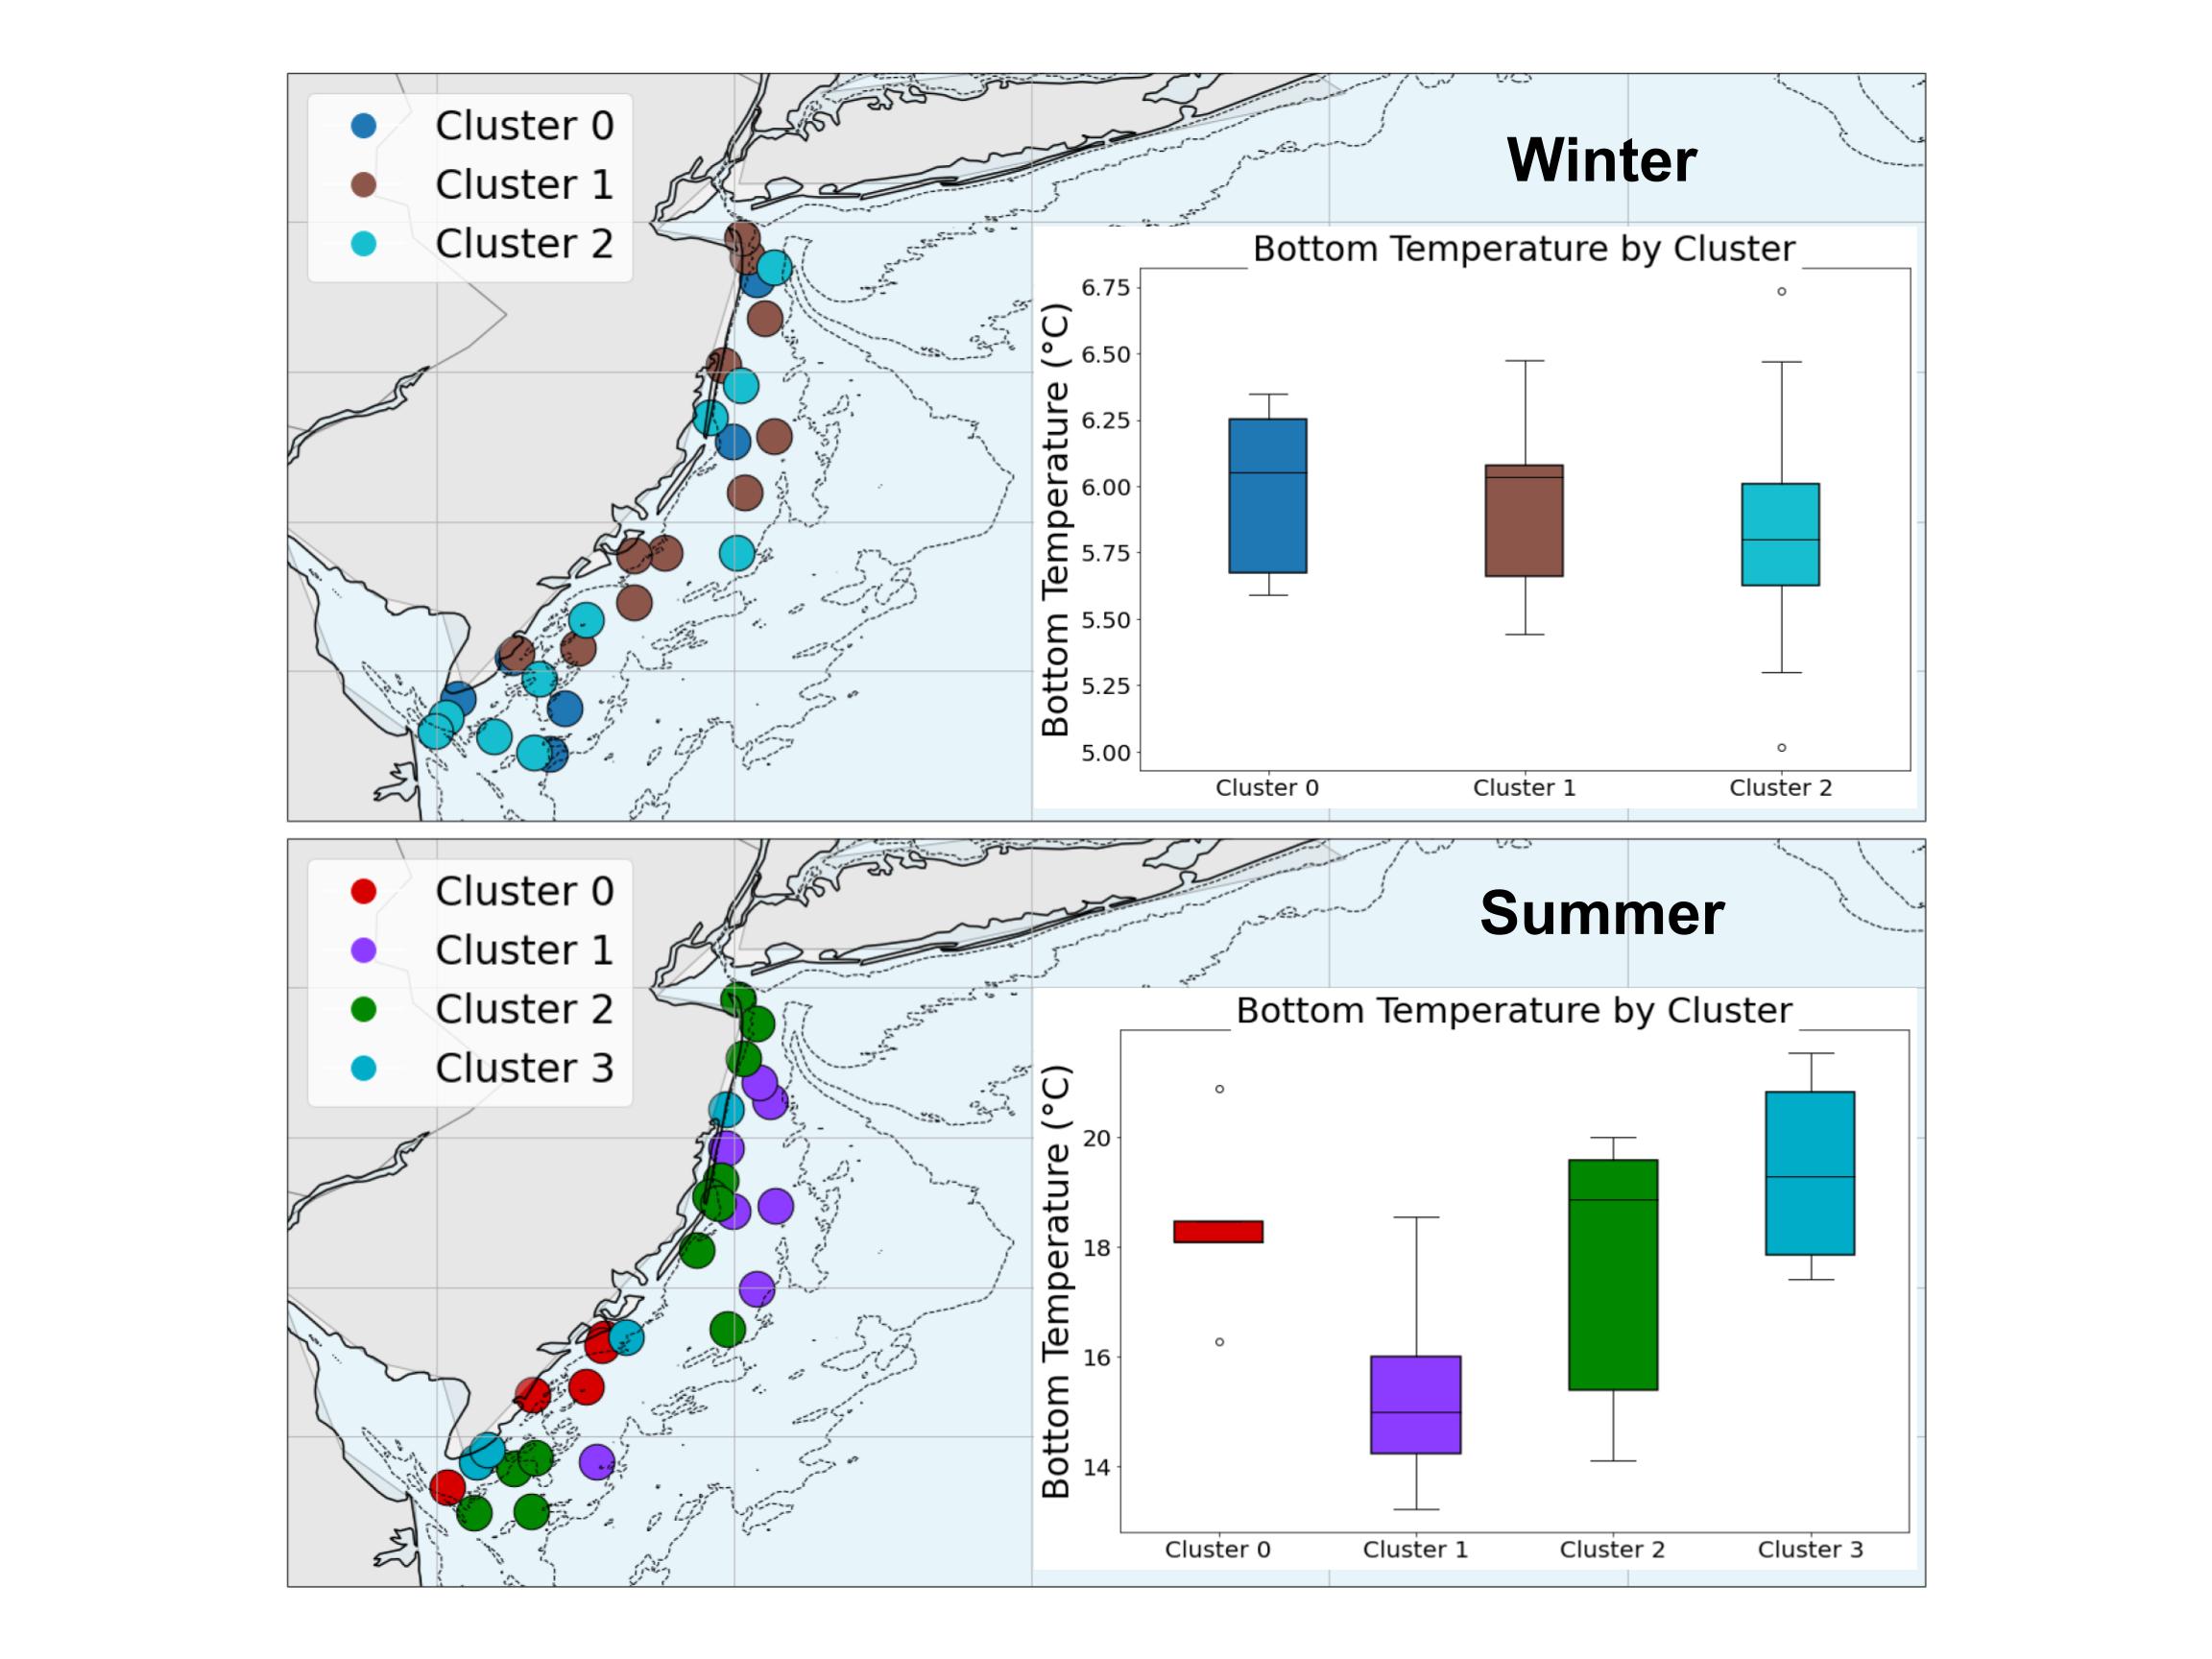
Q2: Used sklearn for training a simple random forest classifier. eDNA read abundances were converted to a binary format where all species detected at a particular site were represented as a 1. The model was then asked to predict the presence/absence of each species using surface and bottom temperature, salinity, and stratification. Then, I used k-means clustering to identify the optimal # of fish communities by season, group eDNA stations into communities, and predict community assignment from the same oceanographic variables. Models were generally far more accurate in summer stratified than winter mixed seasons, with dominant taxa also differing by season.
Outputs:
Project poster: click here to open in a new tab. I presented this poster at ASLO 2025.